Figure 1.
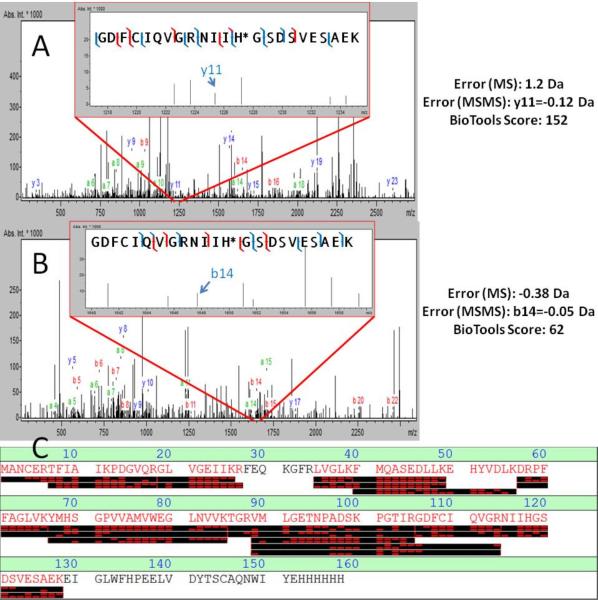
Detection of histidine phosphorylation via LC/MS/MS. A and B) Fragmentation spectra of histidine phosphorylated peptide containing His118 from NM23-H1 in pH 5.0 and 6.0 solvents, respectively. Inlays represent zoomed regions showing appropriate fragment ions to indicate detection of histidine phosphorylation. Included with A and B are errors for the peptide and appropriate fragment, along with a map of detected ions and BioTools score. Blue hash marks show tolerances set to 1.5 Da for MS and 0.5 Da for MS/MS. Red hash marks indicate fragments detected when the tolerance for MS/MS was opened to 0.8 Da. C) Sequence coverage for NM23 H1-His6 from the pH 5.0 data-dependent MS3 run.

