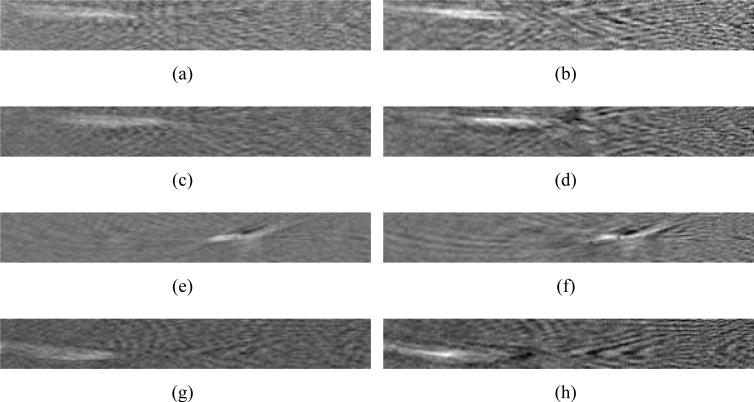
Fig. 12.
Slices through the 3D images reconstucted from the experimental data set. The slices are parallel to the x-o-z plane indicated in Fig. 5. The images, from top to bottom, correspond to different locations along y-axis as: (a),(b) y = –5.95 mm, (c),(d) y = –3.85 mm, (e),(f) y = –0.35 mm, and (g),(h) y = 2.45 mm. The left column of images corresponds to the use of He while the right column corresponds to the use of H.

