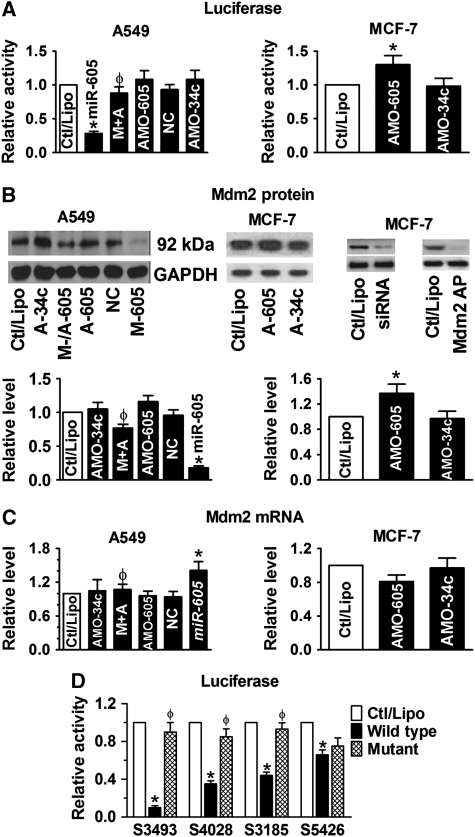
Figure 1.
Mdm2 as a target of miR-605 for post-transcriptional repression. (A) Role of miR-605 in repressing Mdm2, determined by luciferase activity assays with the pMIR-REPORT luciferase miRNA expression reporter vector carrying the 3′UTR of miR-605 target gene Mdm2 in A549 (left) and MCF-7 (right) cells. AMO-605 and AMO-34a: antisense nucleotides to miR-605 and miR-34a (used as a control), respectively; M+A: co-transfection of miR-605 and AMO-605; NC: negative control with scrambled miRNAs. Control cells were mock treated with lipofectamine 2000 (Ctl/Lipo). *P<0.05 versus Ctl/Lipo; φP<0.05 versus miR-605 alone; n=6 for each group. (B) Western blot analysis revealing repression of Mdm2 protein by miR-605 in A549 cells (left) and in MCF-7 cells (right). M-/A-605: co-transfection of miR-605 and AMO-605; A-605: AMO-605; A-34a: AMO-34a; M-605: miR-605; NC: negative control with scrambled miRNAs; Mdm2 AP: antigenic peptide; siRNA: small interference RNA to Mdm2. *P<0.05 versus Ctl/Lipo; φP<0.05 versus miR-605 alone; n=4 for each group. (C) Effect of miR-605 on Mdm2 mRNA level in A549 (upper) and MCF-7 (lower). M+A: co-transfection of miR-605 and AMO-605; NC: negative control with scrambled miRNAs. *P<0.05 versus Ctl/Lipo; φP<0.05 versus miR-605 alone; n=4 for each group. (D) Comparison of the effects of miR-605 on luciferase activities in A549 cells generated by the pMIR-REPORT vectors each carrying a wild-type or mutated fragment of Mdm2 3′UTR that spans a single predicted binding site for miR-605. Note the differential strengths of inhibition luciferase activities by miR-605 among the different fragments and the abolishment or abrogation of the effects with the mutant fragments. S3493 indicates the fragment spanning the predicted binding sites starting at location of 3493 of Mdm2 mRNA (Supplementary Figure S1); the same meaning applies to other three labels. *P<0.05 versus Ctl/Lipo; φP<0.05 wild-type versus mutant; n=3 for each group.

