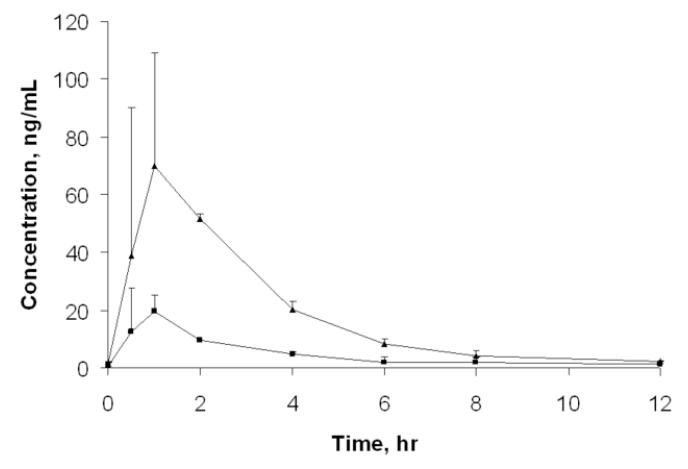
Figure 5.
Plasma concentration – time profile of ARM and DHA. Triangle with solid line, DHA; Square with solide line, ARM. Each data point represents mean concentrations from three healthy volunteer subjects except for at 0.5 and 2 hrs which are based on the mean concentrations for two subjects. The variation bars for data points except for at 0.5 and 2 hrs are standard deviations representing inter-subject variation.

