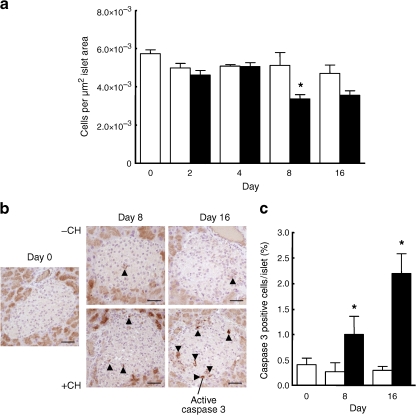
Fig. 3.
Reduction of the number of insulin-positive cells. a Morphometric determination of the relative number of cells per μm2 islet area after the diet change from a carbohydrate-free (white bars) to a carbohydrate-containing (black bars) diet. From each mouse, 35 islets in one to six pancreatic sections were evaluated in a blinded procedure. b Immunostaining of activated caspase-3 in islets of NZO mice treated with (+CH) or without (−CH) carbohydrates for 8 and 16 days. c Quantification of caspase-3-positive cells from NZO mice fed the indicated diets. Data represent mean±SEM of three to six mice, calculated from the mean values of the individual mice. *p < 0.05 for –CH vs +CH at the indicated time point

