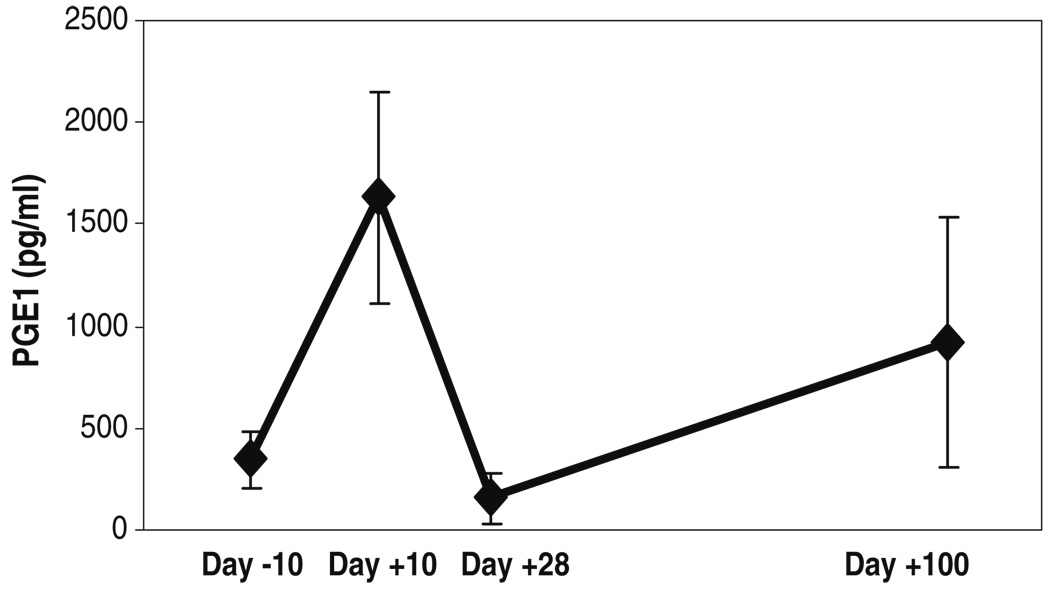
Fig. 7.
Mean (±SD) salivary PGE1 levels of the three subjects at the different time-points before and after administration of high-dose chemotherapy. These mean scores were obtained by calculating an average of the PGE1 levels (in picograms per milliliter) obtained by ELISA, for each subject, at each time-point

