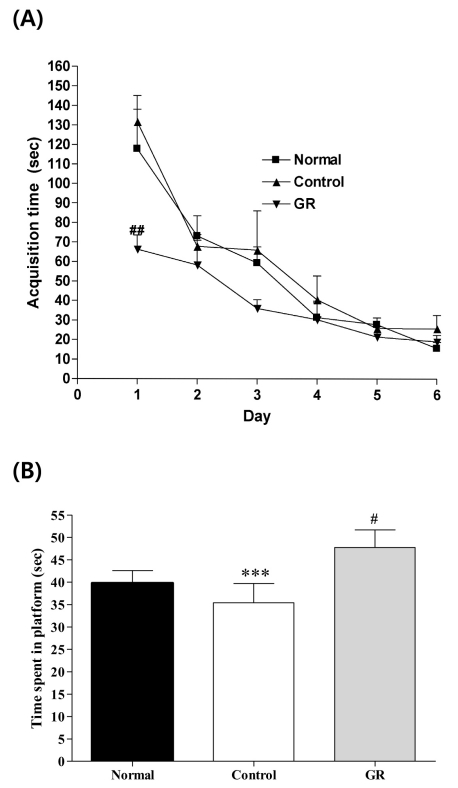
Fig. 2.
(A) Changes of the latency time during 6d of the acquisition test in the Morris water maze test. The AM group was daily treated with the GR extract (400 mg/kg, p.o.) for 2 weeks, and other groups were given sterile saline. Immobilization began 30 min after the treatments. Repeated measures of two-way ANOVA of swimming time among the groups following by LSD test. Each value represents the mean±S.E.M. ##p<0.01 compared to control group. (B) The latency time on the 7th day of the retention test in the Morris water maze test. The GR group was daily treated with the GR extract (400 mg/kg, p.o.) for 2 weeks, and other groups were given sterile saline. Immobilization began 30 min after the treatments.The results of retention test were analyzed by performing separate measures of one-way ANOVA of swimming time among the groups were followed by LSD test. Each value represents the mean±S.E.M. ***p<0.001 compared to normal group and & #p<0.05 compared to control group, respectively.

