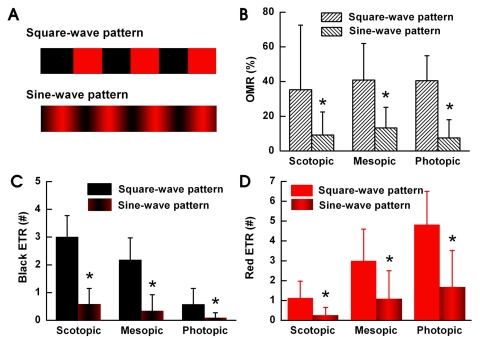
Fig. 3.
OMR occurs when an edge is perceived. We measured the OMR and ETR responses induced by the square and sine wave patterns as shown on (A) under each light illumination condition (n=8). (B) Under all three light illumination conditions, the OMR results decreased significantly when we changed to using the sine wave pattern. (C) Under all three light illumination conditions the black-ETR results from using the square wave pattern were significantly higher than when we used the sine wave pattern. The black-ETR from the square wave or sine wave pattern was the greatest under scotopic conditions and decreased as the surroundings brightened. (D) The red-ETR from the square wave or sine wave pattern was the lowest under scotopic conditions and increased as the surroundings brightened. Under all three light illumination conditions, the red-ETR results decreased significantly when we used the sine wave pattern. *p<0.05 compared with square-wave pattern.

