Figure 7.
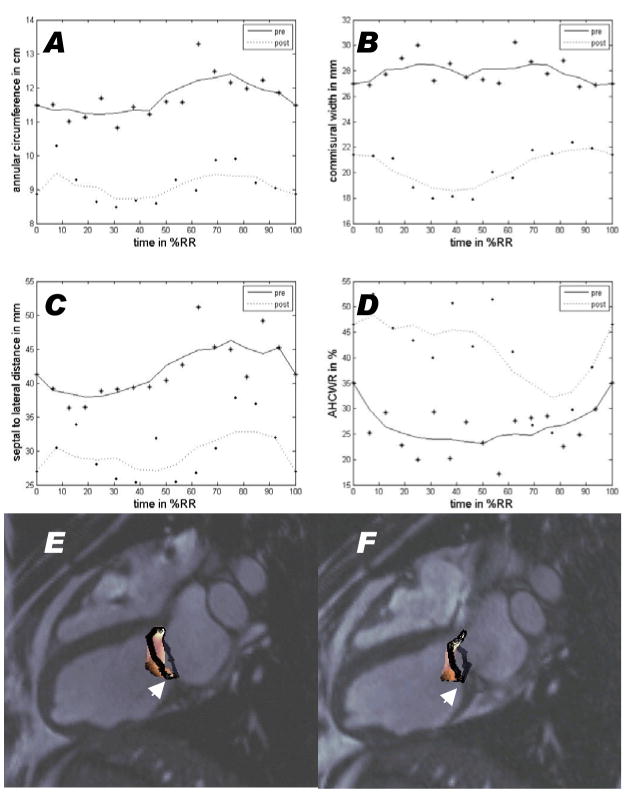
Dynamics of mitral annulus measurements over time before (solid line) and after (dotted line) cerclage tension is applied. The time scale is normalized for a single cardiac cycle beginning with the QRS gating signal for MRI. Cerclage reduces annular circumference (A), commissural width (B), and septal-lateral distance (C) but increases annular height to commissural width ratio (AHCWR, a measure of annular flattening, D). All vary throughout the cardiac cycle and continue to vary despite application of annular tension. (E–F) depict the annulus (black) and leaflet (colored) morphology derived from MRI before (E) and after (F) application of cerclage tension. The posterior annulus (arrow) is displaced caudally toward the posterior papillary muscle when cerclage tension is applied. This is animated in videos 3 and 4.

