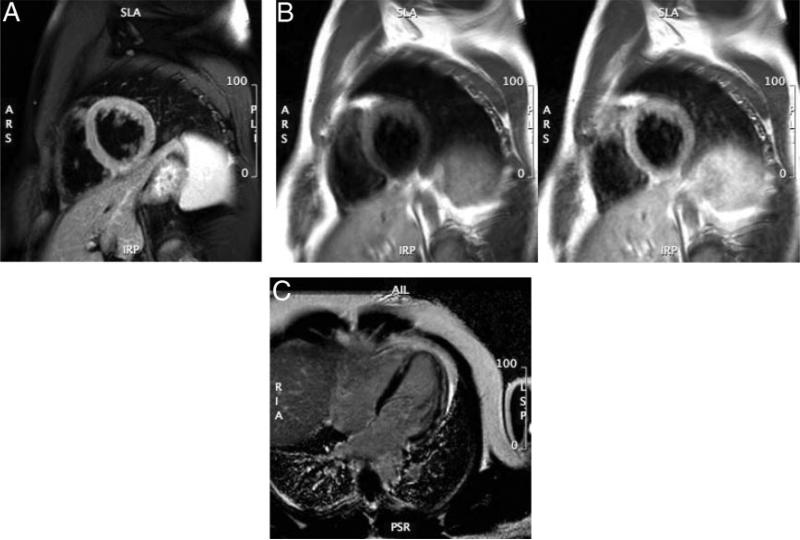
Figure 1.
Cardiovascular magnetic resonance of acute myocarditis. Panel A: T2-weighted image of LV myocardial edema showing global bright signal intensity (ratio 2.2) of the left ventricle relative to the myocardium. Panel B: Early enhancement (T1-weighted spin echo) before (left) and after (right) Gd administration; enhancement ratio 5.4. Panel C: Arrows indicating late enhancement (T1-weighted gradient echo sequence with myocardial nulling) 10 minutes after Gd. Gd indicates gadolinium; and LV, left ventricular.

