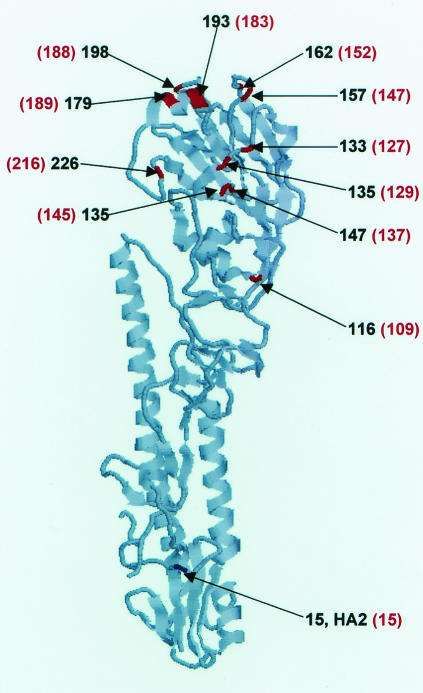
FIG. 1.
Locations of the amino acid changes in the HA of H9 escape mutants mapped on the three-dimensional map of A/Swine/Hong Kong/9/98 HA (8). Amino acids were mapped on the three-dimensional structure with the RasMol 2.6 program (available at http://www.umass.edu/microbio/rasmol/getras.htm). Positions of amino acid changes detected by the binding of MAbs are shown in red, and the position of the change resulting from mouse adaptation is shown in blue. Numbering corresponds to the HA of subtype H3. H9 numbering (8) is presented in red in parentheses.

