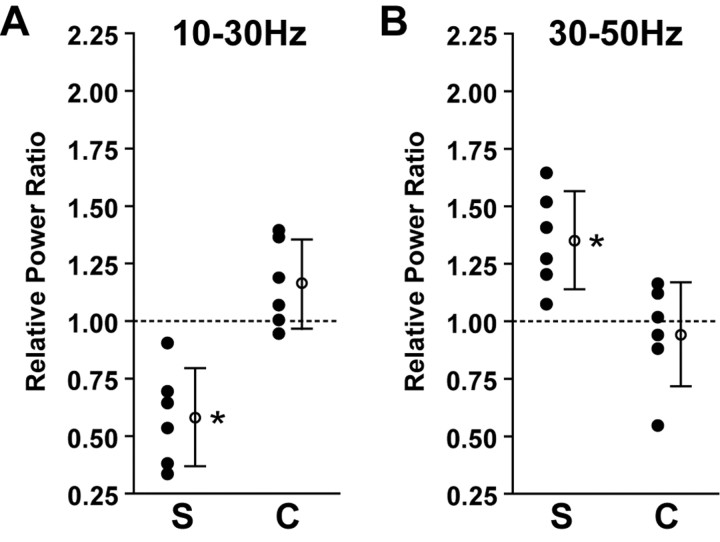
Figure 11.
Specific increase in γ activity is contrast dependent in simple but not complex FRB cells. Relative power ratios were calculated using the responses to drifting sinusoidal gratings at contrasts of 2 and 64% contrasts. A, Power in the 10-30 Hz range was significantly decreased in simple cells (S) (n = 6; p < 0.001) and unchanged in complex cells (C) (n = 6; p > 0.05) during stimuli of optimal orientation. The mean 10-30 Hz relative power ratio for the simple cells was significantly lower than that of the complex cells (p < 0.01). B, In contrast, power in the 30-50 Hz range was significantly increased in simple cells (S) (p < 0.001) and unchanged in the complex cells (C) (p > 0.05) during stimuli of optimal orientation. The mean 30-50 Hz relative power ratio for the simple cells was significantly higher than that of the complex cells (p < 0.01). Asterisks denote p < 0.01. Error bars represent SEM.

