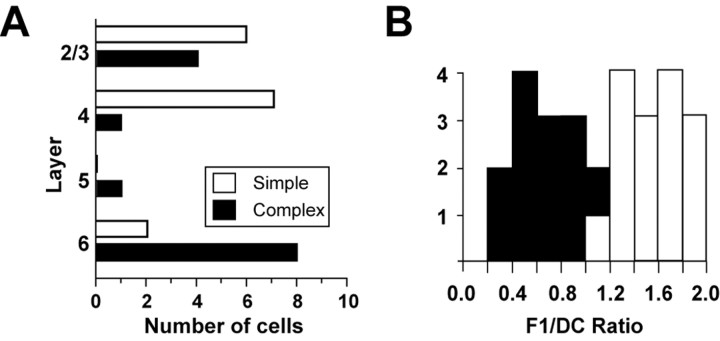
Figure 5.
Laminar distribution of simple and complex FRB cells. A, Simple FRB cells (n = 15) were found in layers 2/3, 4, and 6. Complex FRB cells (n = 14) were found in layers 2/3, 4, 5, and 6. B, F1/DC ratios taken from the spike responses of the FRB cells. The mean complex F1/DC ratio was 0.68 ± 0.2 (filled bars), and the mean simple F1/DC ratio was 1.57 ± 0.3 (open bars).

