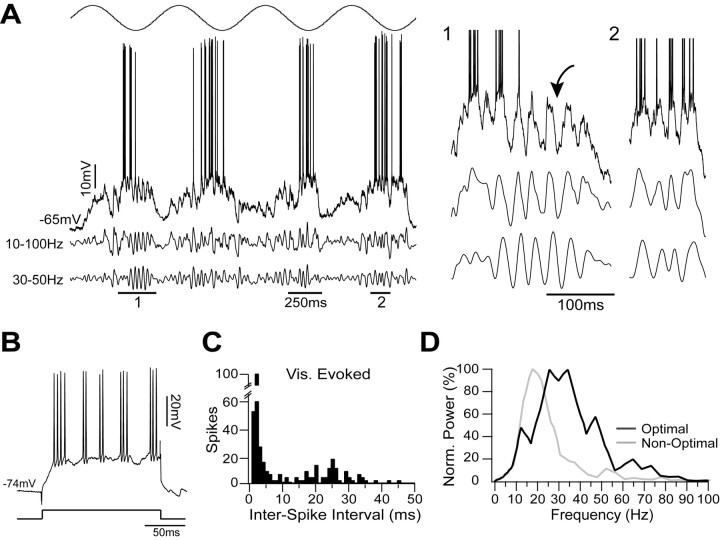
Figure 6.
Simple FRB cells show visually evoked γ oscillations. A, Simple cell stimulated with an optimal drifting sinusoidal grating (top). After spike removal, the trace was filtered between 10 and 100 Hz (middle trace) and between 30 and 50 Hz (bottom trace). During the depolarizing phases of the response to the grating, the traces showed a strong modulation at ∼40 Hz (details 1 and 2), which was often, but not always, accompanied by spikes (arrow). B, This cell responded to a depolarizing current pulse of 0.8 nA with the typical FRB bursting pattern. C, The interspike interval histogram of visually (Vis.) evoked activity showed a peak at short latencies (2.5 ms) and one centered on 25 ms. D, The power spectra of short epochs (400 ms; n = 8 epochs) from the 10-100 Hz filtered traces were calculated for an optimal stimulus and a nonoptimal stimulus (18° from optimal). Each set of power spectra was then averaged, and the resulting mean power spectrum was normalized (Norm.) to its maximum value. Whereas the mean power spectrum for the nonoptimal stimulus (gray line) showed the most power between 10 and 30 Hz, the power spectrum for the optimal stimulus (black line) showed increased power in the 30-50 Hz range.

