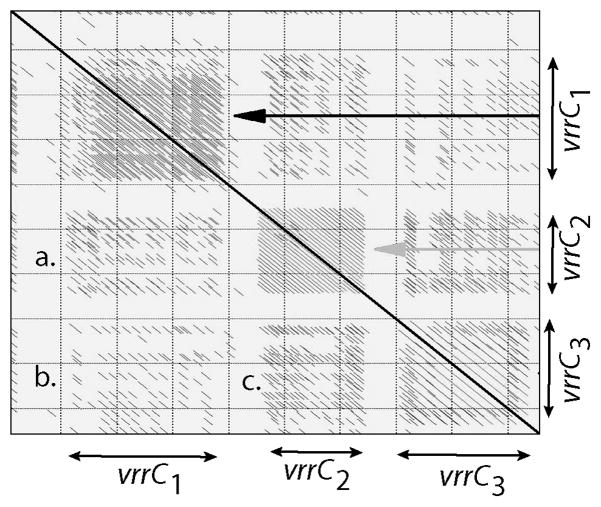
Figure 4.
A dotplot homology analysis of the vrrC locus.
The VNTR region of the vrrC gene was analyzed using a dot plot algorithm, which compares a particular sequence against itself. The diagonal lines are indicative of directly repeated DNA sequences in this region of the genome. The strong diagonal line in the middle is the identity line and each half of the box contains the same information, in a mirrored fashion. Note that there are three separate tandemly repeated subregions, termed vrrC1, vrrC2, and vrrC3. The strong diagonal lines near the identity line, show the level of identity between direct repeats and the spacing also is indicative or the repeat length. Each subregion is compared to the others in a pair-wise fashion as indicated: a) vrrC1 × vrrC2; b) vrrC1 × vrrC3; and c) vrrC2 × vrrC3.

