FIG. 1.
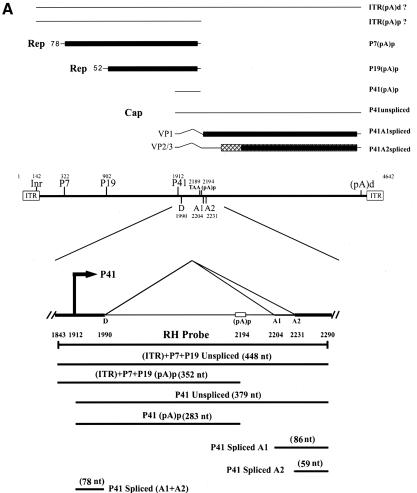
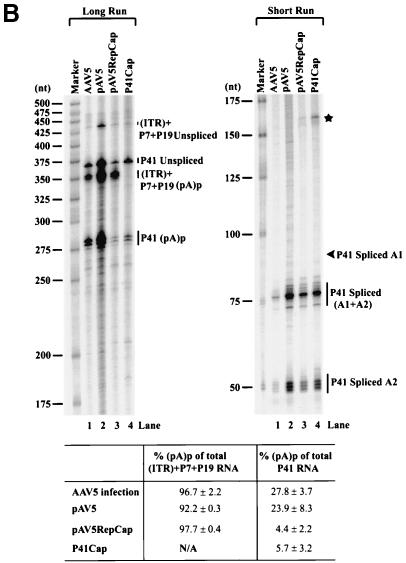
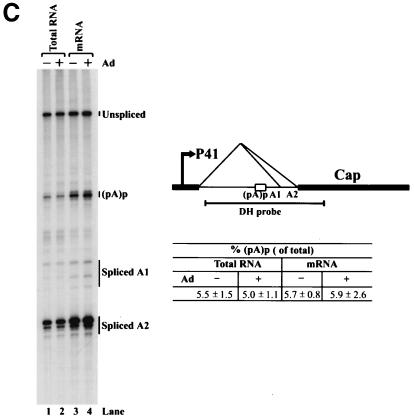
(A) Genetic map of the AAV5 and the RH probe. The 4,642-nt AAV5 genome is shown to scale with the major transcriptional landmarks indicated, including the ITRs, promoters, the initiation sites for the various RNAs, the 5′ splice site (D) and the 3′ splice sites (A1 and A2), and the proximal [(pA)p] and distal [(pA)d] polyadenylation sites. The major transcripts observed in our previous report (26), and in the present study, are listed on the right. Transcripts generated from the ITR have not been fully characterized and so are marked with a question mark. The start site for the ITR-initiated transcripts map to an initiator region (Inr) in the ITR (26). The RH probe (nt 1843 to 2290), which spans the P41 promoter and the intron, is diagrammed on the bottom, and the individual bands protected by RNase protection assay and their sizes are shown as indicated. (B) RNAs generated from the P7 and P19 are polyadenylated at (pA)p at high efficiency, whereas P41-generated RNAs are primary polyadenylated at the (pA)d site. 293 cells were either infected with AAV5 and adenovirus or transfected with an infectious clone (pAV5), an AAV5 RepCap plasmid (pAV5RepCap), or the P41 minimal construct (P41Cap) in the presence of adenovirus coinfection. After 36 to 40 h, cells were harvested and total RNA was isolated. Then, 10 μg of total RNA was protected by the RH probe, and samples were subjected to 6% denaturing polyacrylamide gel electrophoresis for either 3 h 30 min (long run, left panel) or 1 h 30 min (short run, right panel). An RNA marker ladder with their respective sizes is shown on the left. A representative experiment is shown with the identities of the protected bands on the right. Quanitifications of the percentage of the total ITR+P7+P19-generated RNAs polyadenylated at (pA)p or the percentage of the total P41-generated RNAs polyadenylated at (pA)p are shown as averages of the results of at least three individual experiments with standard deviations. P41-generated RNA spliced at A1 is poorly detected by the RH probe. The band marked with an asterisk is most likely a degradation product, and was not seen in other experiments. RNA from unifected cells generated no protection products. (C) The relative ratio of (pA)p is the same in poly(A)-containing RNA, and the DH probe detects relative levels of (pA)p RNAs similar to those detected by the RH probe. Both total and oligo(dT)-selected mRNA were isolated from P41Cap-transfected 293 cells either in the absence or presence of adenovirus coinfection. A total of 10 μg of total RNA or mRNA purified from 20 μg of total RNA were protected by the DH probe as shown in the diagram. A representative experiment is shown with the identities of the protected bands on the right. Quantification of the ratios of RNAs polyadenylated at (pA)p, relative to the total protected RNAs, are shown as averages of the results from at least three individual experiments with standard deviations. RNA from uninfected cells generated no protection products.


