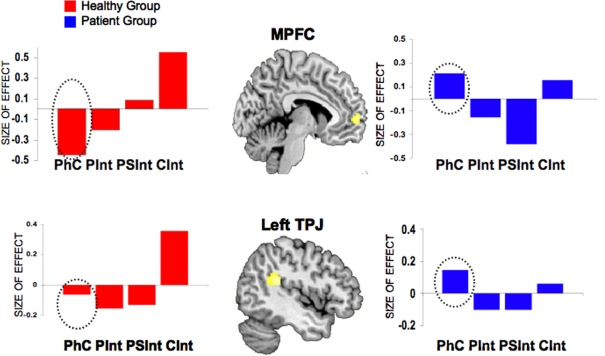
Figure 8.
Group comparisons between healthy controls and patients with paranoid schizophrenia. Mean activation effects (estimated beta parameters, 95% confidence interval) of the contrast CInt vs Ph-C for MPFC and left TPJ. The activation effects were extracted from the second level between-group ANOVA. Dashed circles indicate the beta parameters for the control condition (Ph-C). Ph-C, Physical causality; CInt, Communicative intention.

