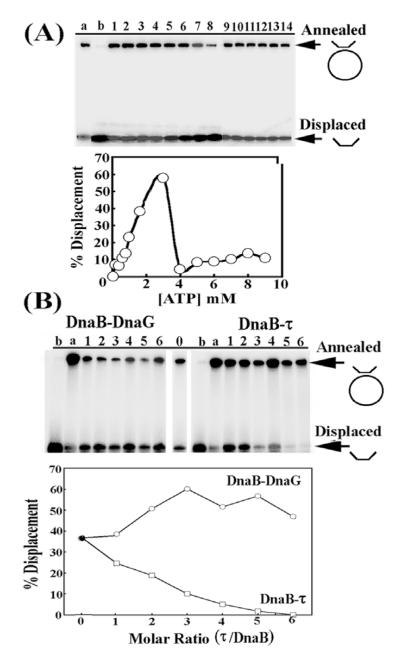
Figure 4.
The effect of τ on DnaB activity in vitro. (A) The helicase activity of DnaB as a function of ATP concentration. Arrows indicate annealed (substrate) and displaced (product) oligonucleotides. Lanes 1–14 are presented as percentage displacement of annealed oligo-nucleotides as a function of ATP concentration. Increasing concentrations of τ inhibit DnaB. The data are shown also in graphical representation. (B) The helicase activity of DnaB as a function of increasing τ to DnaB molar ratio (pentamer:hexamer). For comparison, a control experiment of the helicase activity of DnaB as a function of increasing DnaG:DnaB (monomer:monomer) molar ratio is shown. Lanes 1–6 are presented as percentage displacement of annealed oligonucleotides as a function of increasing τ to DnaB molar ratio. Increasing concentrations of DnaG stimulate DnaB. Lanes a and b in both panels represent annealed and boiled controls, respectively.

