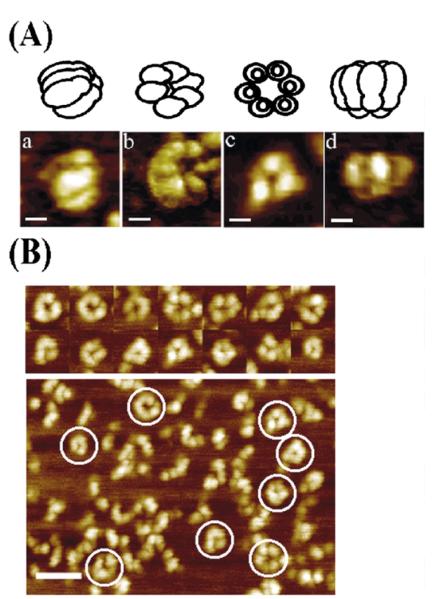
Figure 5.
AFM images of DnaB. (A) Selected AFM images of DnaB adsorbed onto mica. Each image represents different views of DnaB observable with the AFM, as a result of alternative adsorption orientations and/or conformations onto the mica, along with models on top of each image for clarity. Images (phase) a and d, recorded with a nanotube AFM probe, show side-views of hexamers lying parallel with the surface. Image b (phase) shows a view of a partially tilted DnaB molecule with a 6-fold symmetry. Image c (topography) shows a “trimer of dimers” view down the 3-fold symmetry axis. For all images, the scale bars represent 10 nm. (B) Some representative examples (topography) of molecules viewed from a distance are shown together with a representative field view. The selected images shown in (A) are highly representative samples from a large number of field views obtained from many imaging experiments. The scale bar represents 50 nm.

