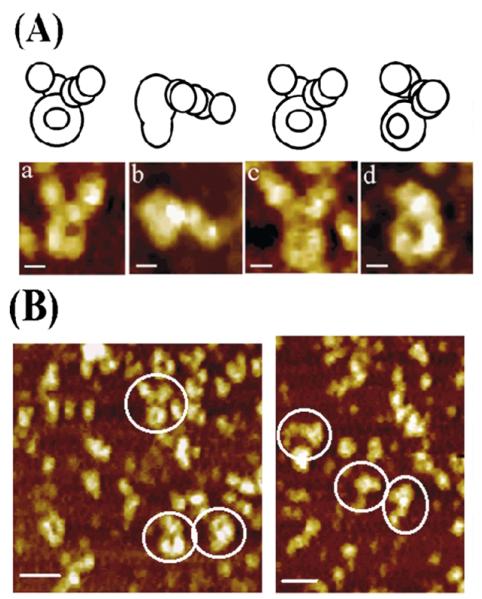
Figure 7.
AFM topography images of the τ–DnaB complex. (A) AFM images of the τ–DnaB complex in different views with schematic models on top, showing possible orientations and/or conformations. For all images, the scale bars represent 10 nm. (B) Two representative examples of larger field views with molecules viewed from a distance are shown. By comparison with DnaB and τ images, the number of complexes observed was clearly lower (see the text for explanation). The scale bar represents 50 nm.

