
Figure 5. Photographs and data from animal validation experiments.
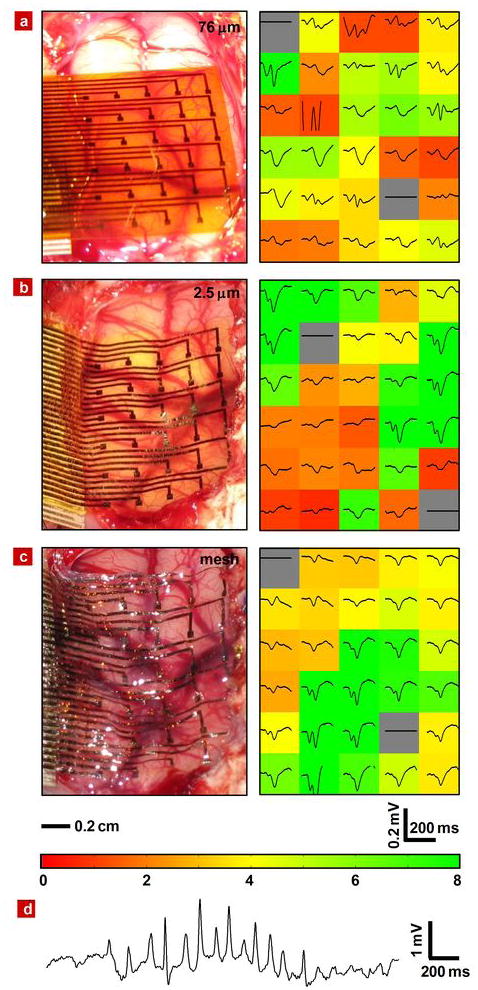
Image of electrode array on feline brain (left) and average evoked response from each electrode (right) with the color showing the ratio of the RMS amplitude of each average electrode response in the 200 ms window (plotted) immediately after the presentation of the visual stimulus to the RMS amplitude of the average 1.5 second window (not shown) immediately preceding the stimulus presentation for 76 μm a, 2.5 μm b and 2.5 μm mesh c electrode array. The stimulus presentation occurs at the left edge of the plotted window. In all 3 images, the occipital pole is at the bottom of the frame and medial is at the right. The scale bars at the bottom of c indicate the spatial scale for the left frames and the voltage and time scales for the right frames of a,b and c. The color bar at the bottom of c provides the scale utilized in the right frames of a,b, and c to indicate the RMS amplitude ratios. d, Representative voltage data from a single electrode in a 2.5 μm mesh electrode array showing a sleep spindle.