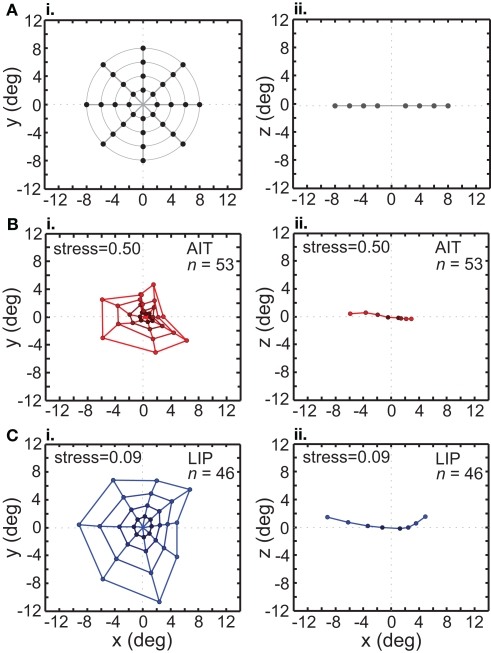
Figure 10.
Recovery of the representation of space from neural population activity, using a global (bull's-eye) stimulus configuration. MDS analysis was performed on interpolated neuronal responses from recorded neurons that had significant spatial selectivity under ANOVA. Left column: plots points from the perspective of the frontoparallel (x–y) plane. Right column: plots points from the perspective of the x–z plane, allowing a view of relative depth of points. The x–z plots are taken along a cross section of space corresponding to the y = 0 axis. (A) Black dots indicate physical configuration of stimulus points. Right column shows that these locations were flat along the frontoparallel plane and did not include a depth component. (B) Configuration of spatial locations recovered from AIT. Coloring becomes darker for points closer to the origin, to aid visualization. (C) Configuration of spatial locations recovered from LIP. Presentation details are the same as in the previous panel. The LIP stress value is lower than in AIT, indicating a more veridical representation of physical space within a 3D manifold.

