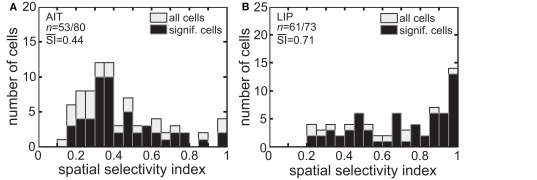
Figure 3.
Spatial selectivity index (SI). The SI was calculated for each recorded cell using Eq. 1. The resulting histogram is shown for (A) AIT and (B) LIP. Presented are SI values for all recorded cells as well as for only those cells showing significant spatial selectivity. Mean SI value for spatially significant cells is also shown in each panel.

