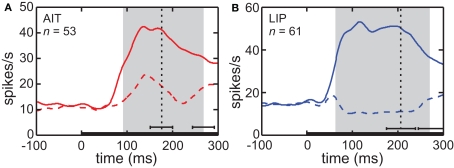
Figure 4.
Average time course of responses (PSTH). (A) AIT and (B) LIP. Average time course was calculated over all cells showing significant spatial selectivity, at the most responsive location and least responsive location. Zero time marks presentation of the stimulus in the periphery. Vertical dotted line is the average time of the saccade away from central fixation toward the stimulus. Error bar indicates the standard deviation of the saccade time. The gray region shows the time period used for analyses of the data (ANOVA, SI, and MDS). That period started at stimulus onset and ended at the time of the saccade away from fixation, both times shifted by the average latency of the visual response. Error bar indicates standard deviation of the end of the gray period, due to variations in the time of saccade away from central fixation.

