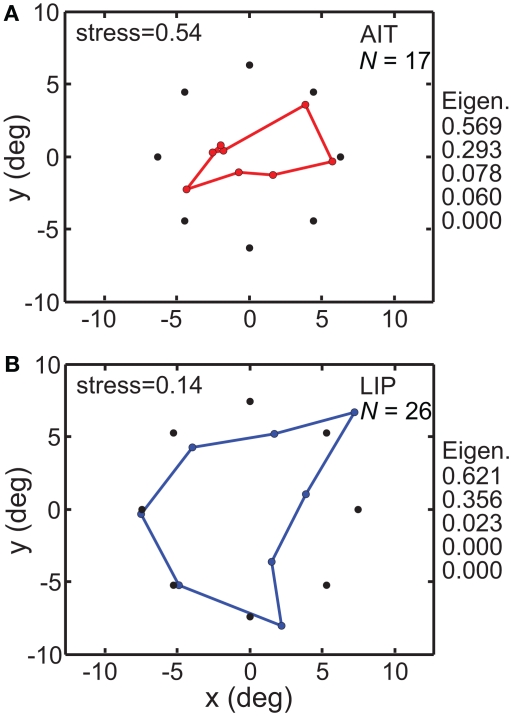
Figure 5.
Spatial configuration of stimulus points recovered by multidimensional scaling. MDS analyses were performed on populations whose stimulus locations were tightly clustered around a narrow range of eccentricities. Black dots indicate average location of stimuli, colored dots indicate recovered spatial configuration. (A) AIT, based on 17 neurons with stimuli located at mean 6.31 ± 0.70° SD eccentricity and eight fixed polar angle locations. (B) LIP, based on 26 neurons stimulated at mean 7.44 ± 0.16° SD eccentricity and eight fixed polar angle locations. Also displayed on right are five largest normalized eigenvalues from the MDS analysis. Both stress values and eigenvalues indicate that physical space was more accurately represented in LIP than in AIT, for representations confined to a 3D manifold within the high-dimensional neural response space.

