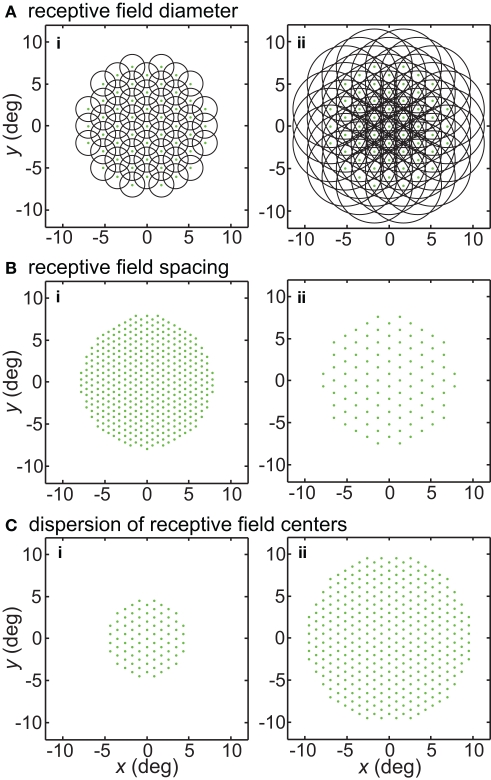
Figure 1.
Illustration of parameters describing the neural population for encoding space. Green dots mark the locations of receptive field centers. Black circles indicate receptive field diameter, with radius equal to one space constant σ of the 2D Gaussian spatial tuning curve. In the model, characteristics of the encoding population are defined by (A) Receptive field diameter, (B) Spacing between receptive field centers, (C) Dispersion of receptive field centers.

