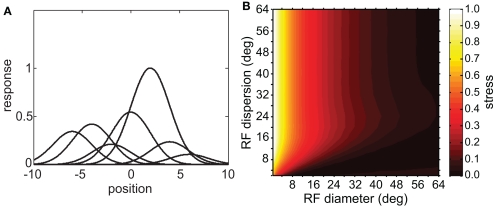
Figure 10.
Spatial representations recovered from an inhomogeneous neural population containing neurons tuned to different shape features. (A) Heights of Gaussian spatial tuning curves varied depending on responsiveness of each neuron to the single shape used as a stimulus. Tuning curves are depicted schematically as 1D functions, whereas they were actually 2D Gaussian functions. Peak heights have been normalized so that the tallest peak is equal to 1.0. (B) 3D plot of stress as a function of RF diameter and RF dispersion, using a population with inhomogeneous shape responsiveness. Stimulus configuration was a 16° diameter grid.

