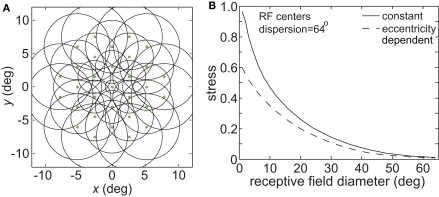
Figure 17.
Effect of variable receptive field diameter on accuracy of low-dimensional spatial representations. (A) Neural population with receptive field diameters increasing linearly as a function of eccentricity. Green dots represent receptive field centers and circles represent one space constant of 2D Gaussian receptive fields. Diagram indicates receptive field configuration schematically for easy visualization, and does not match RF parameters used in simulations. (B) Stress as a function receptive field diameter, for both constant and variable diameter receptive fields. For the variable diameters plot, x-axis value is the foveal RF diameter, with that diameter increasing with slope 1.0 as a function of eccentricity. RF spacing was 0.1° and the stimulus configuration was a 16° diameter grid.

