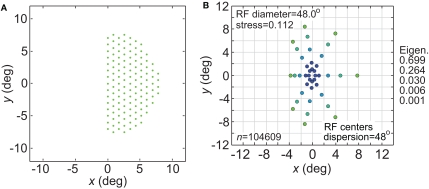
Figure 19.
Effect of confining receptive field centers to one visual hemifield. (A) Green dots represent configuration of receptive field centers responding to right visual field stimuli (left cerebral hemisphere). (B) Representation of space produced by the hemifield receptive field geometry. RF spacing was 0.1° and the stimulus configuration was a 16° diameter grid.

