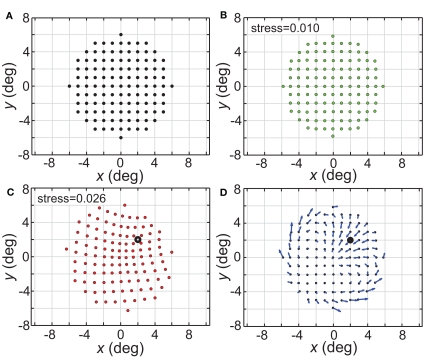
Figure 21.
Distortion of spatial representation in vicinity of a fixed stimulus point. (A) Configuration of stimulus points in physical space. It consisted of a 6° × 6° square grid of points at 1° intervals. (B) Spatial representation of stimulus configuration recovered by neural model. Neural space was mapped presenting one stimulus point at a time, as was done in all previous cases described here. (C) Spatial representation when two stimulus points were presented simultaneously. One stimulus point was held fixed at location (2°, 2°), indicated by the black dot. Neural space was then mapped with a second point presented at different positions along the square grid. RF diameter was 48°, RF dispersion was 48°, and receptive field spacing was 0.1°. (D) Differences between panels (B) and (C) indicate spatial distortions caused by two-point interactions. Blue arrows indicate magnitude and direction of difference for each stimulus point.

