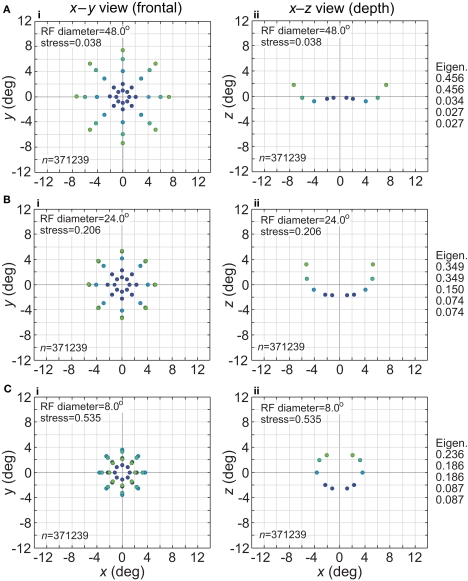
Figure 3.
Spatial representation recovered by the model, for different receptive field diameters. (A) RF diameter = 48° (B) RF diameter = 24° (C) RF diameter = 8°. The number of model neurons in the encoding population is indicated by n. For each receptive field diameter, the left column shows the spatial representation in the x-y or frontoparallel plane. The right column shows curvature of the recovered spatial representation in the z-axis direction, caused by spatial distortion introduced by the neural coding. The x-z plots in the right column are taken along a cross-section of space corresponding to the y = 0 axis. Normalized eigenvalues associated with the multidimensional scaling procedure are displayed to the right of each row. RF dispersion was 64°, RF spacing was 0.1°, and the stimulus configuration was a 16° diameter grid as in Figure 2. Dots are color coded by eccentricity of physical stimulus, in order to ease interpretation of recovered spatial configurations that are highly distorted.

