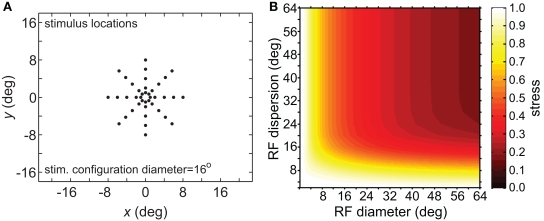
Figure 6.
Three-dimensional plot of stress using principal components analysis rather than multidimensional scaling. (A) Spatial configuration of stimulus, which was a 16° diameter stimulus grid as used in Figure 5B. (B) Stress plotted as a function of RF diameter and RF dispersion.

