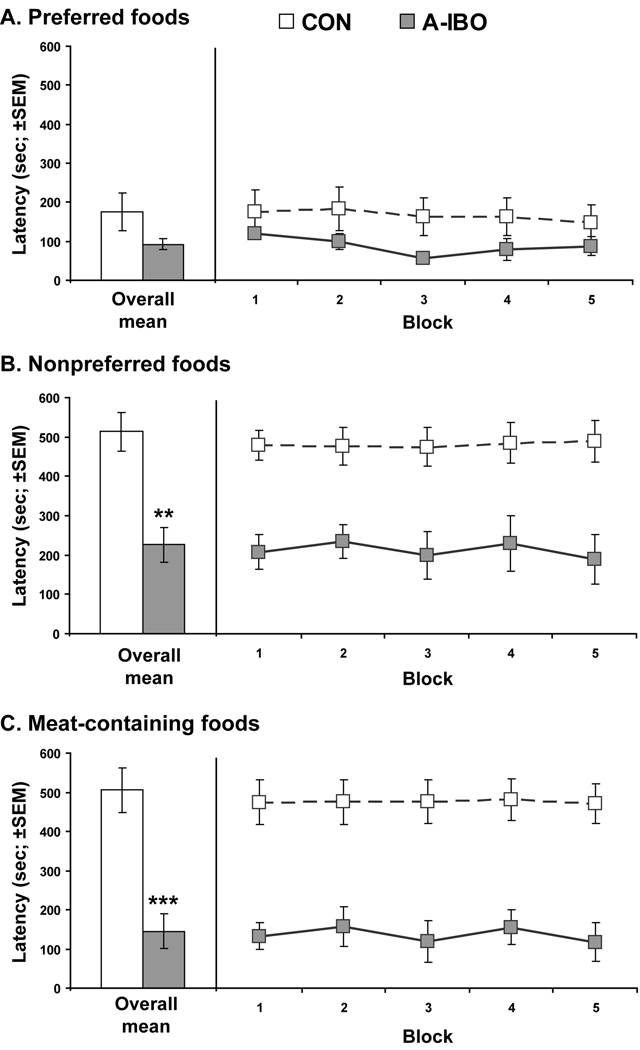
Figure 1.
Selection latencies for Preferred Foods (A), Nonpreferred Foods (B) and Meat-containing Foods (C) for the two experimental groups. White bars and symbols indicate control animals (CON), whereas gray bars and symbols indicate amygdala-lesioned animals (AMYG). The mean across the 10 test days is given on the left side of each graph, and the mean for each two-day block is given on the right side of each graph to show the trends over time. ** p < .01, *** p < .001

