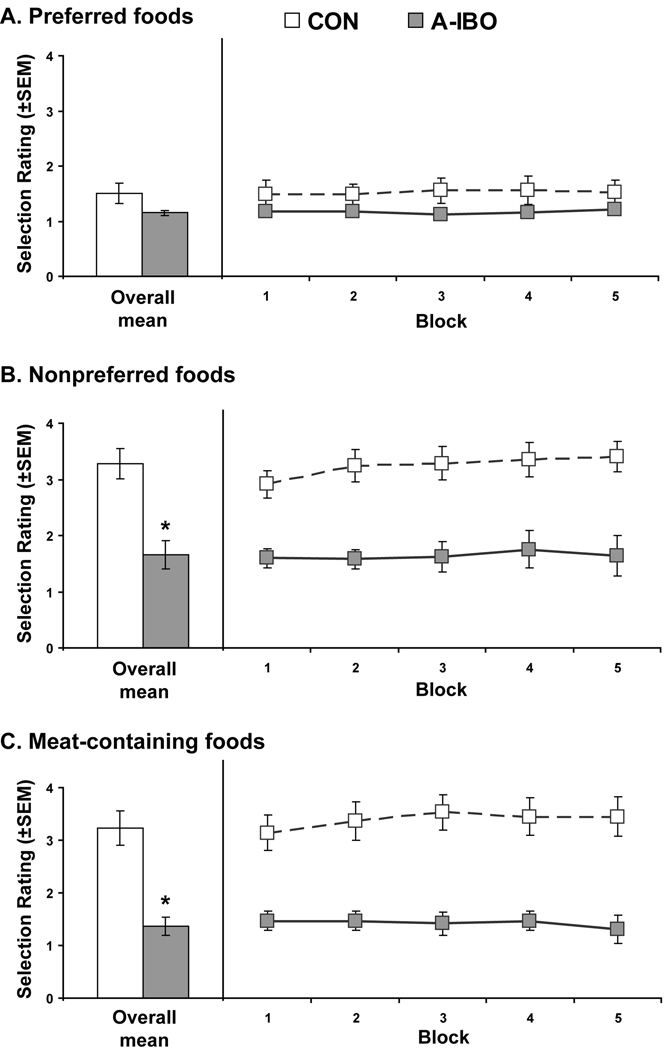
Figure 2.
Selection rating scores for Preferred Foods (A), Nonpreferred Foods (B) and Meat-containing Foods (C) for the two experimental groups. For this measure, lower scores indicate that the animals more readily took the food and placed it in their mouth, either immediately or at some point within the session. All conventions are the same as Figure 1. * p < .05

