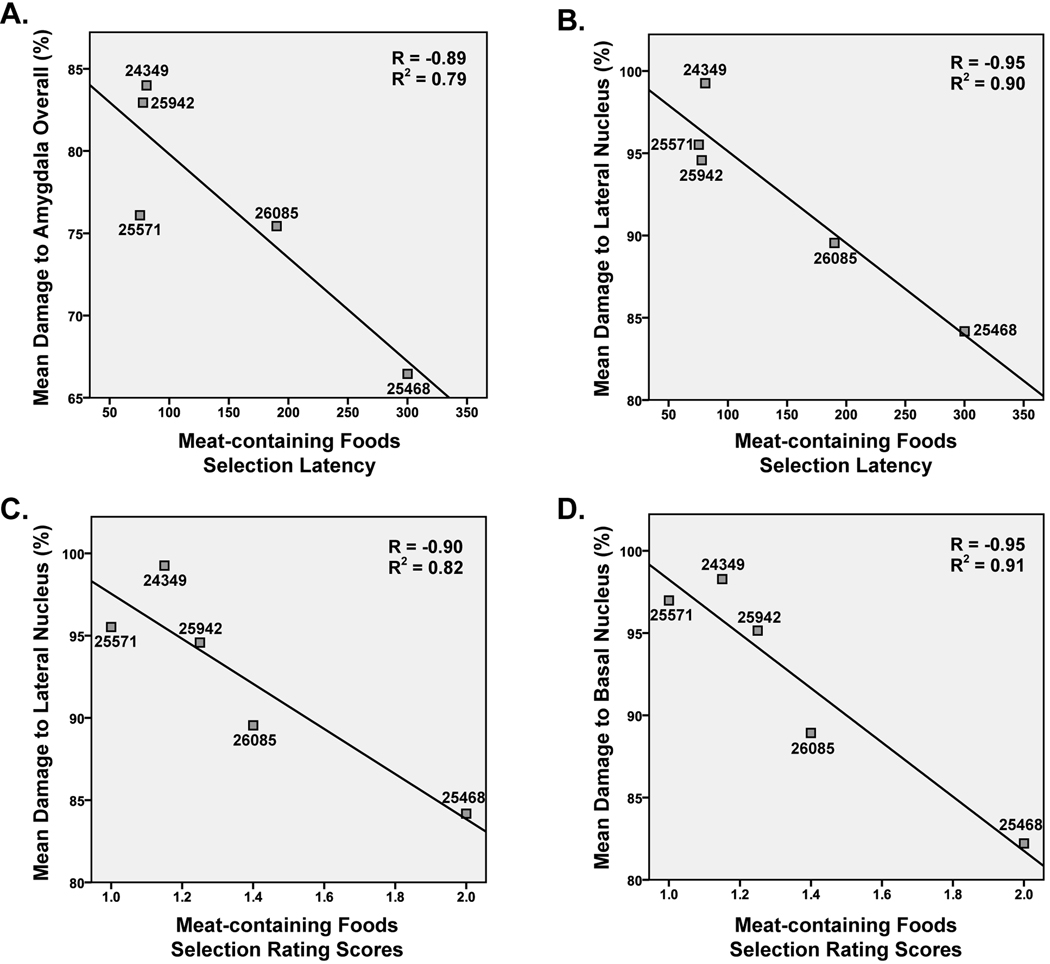
Figure 3.
Correlations between latency to select meat-containing foods and mean amygdala damage (A) or mean damage to the lateral nucleus. Correlations between food selection rating score and mean damage to the lateral nucleus (C) or basal nucleus (D) are also shown. Lines indicate the best fit to the data in each scatter plot. Individual animal numbers are given for each data point to facilitate comparisons to data shown in Tables 1 – 3. Note that data for animal 25627 are not shown in these plots since this animal’s data were not included in final analyses.

