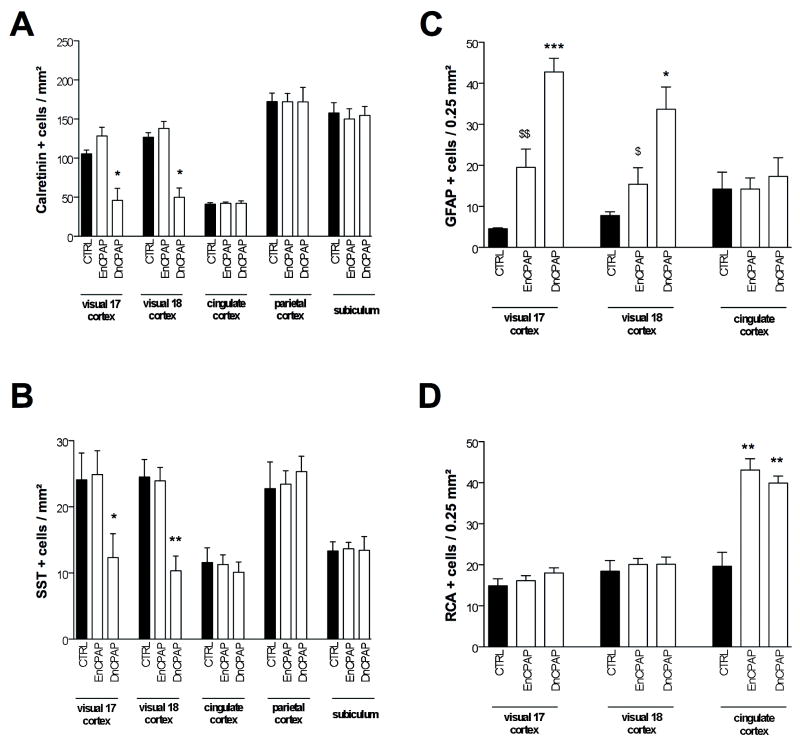
Figure 3.
Quantitative determination of the density of calretinin (CalR)+ (A), somatostatin (SST)+ (B), glial fibrillary acidic protein (GFAP)+ (C), and Ricinus agglutinin 1 (RCA)+ (D) cells in different regions of control and positive pressure ventilation (PPV)-treated preterm baboon infant at 140 days gestation. Bar represents mean density of positive cells ± SEM. Asterisks indicate statistically significant differences from black bars; **p < 0.01 in ANOVA with Bonferroni multiple comparison test.

