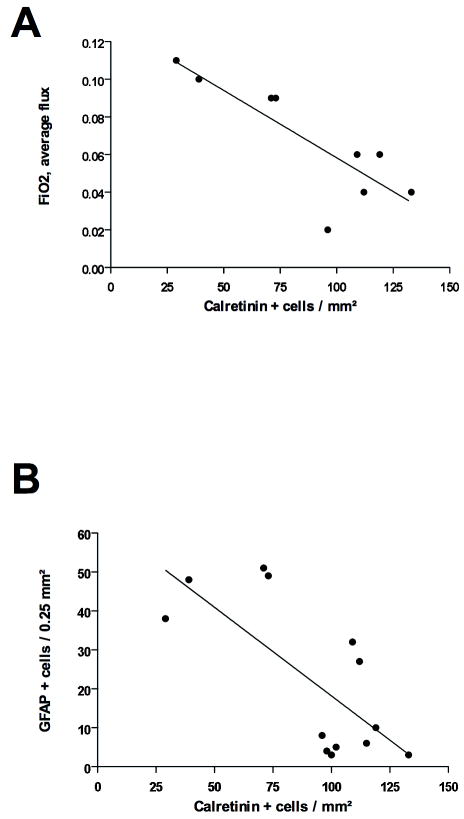
Figure 4.
Quantitative determination of the density of calretinin (CalR)+ (A), somatostatin (SST)+ (B), glial fibrillary acidic protein (GFAP)+ (C), and Ricinus agglutinin 1 (RCA)+ (D) cells in different regions of control, early nasal continuous positive airway pressure (EnCPAP), and delayed CPAP (DnCPAP) treated preterm baboon infant at 153 days gestation. Bars represent mean density of positive cells ± SEM. Asterisks indicate statistically significant differences from control group; “$” indicates statistically significant difference from DnCPAP group; *, $p < 0.05, $$p < 0.01, ***p < 0.001 in ANOVA with Bonferroni multiple comparison test.

