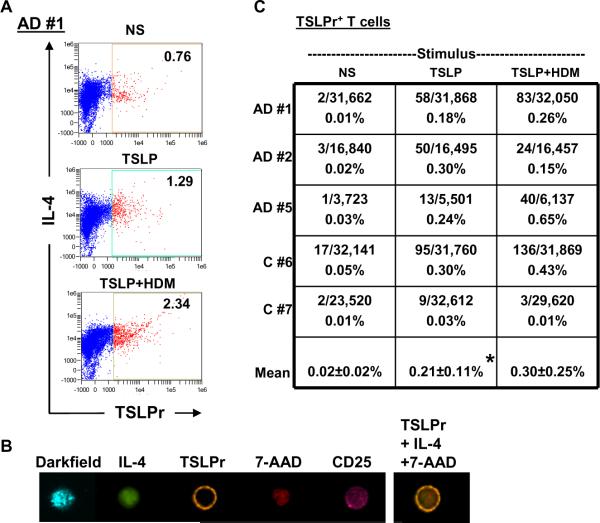
Figure 3. TSLPr+ T Cells are Rare Under Th2-Promoting Conditions.
(A) CD4+ T cells were stimulated and analyzed for TSLPr expression by image-based flow cytometry. Values denote the percentage of cells within a gate that captured all TSLPr+ events by visual inspection. NS, non-stimulated. Data is representative of 5 subjects. (B) Image of a single representative TSLPr+ T cell with corresponding composite image. (C) Table of actual frequencies of TSLPr+ T cells confirmed by inspection of cells (data from 5 subjects, *p=0.015).

