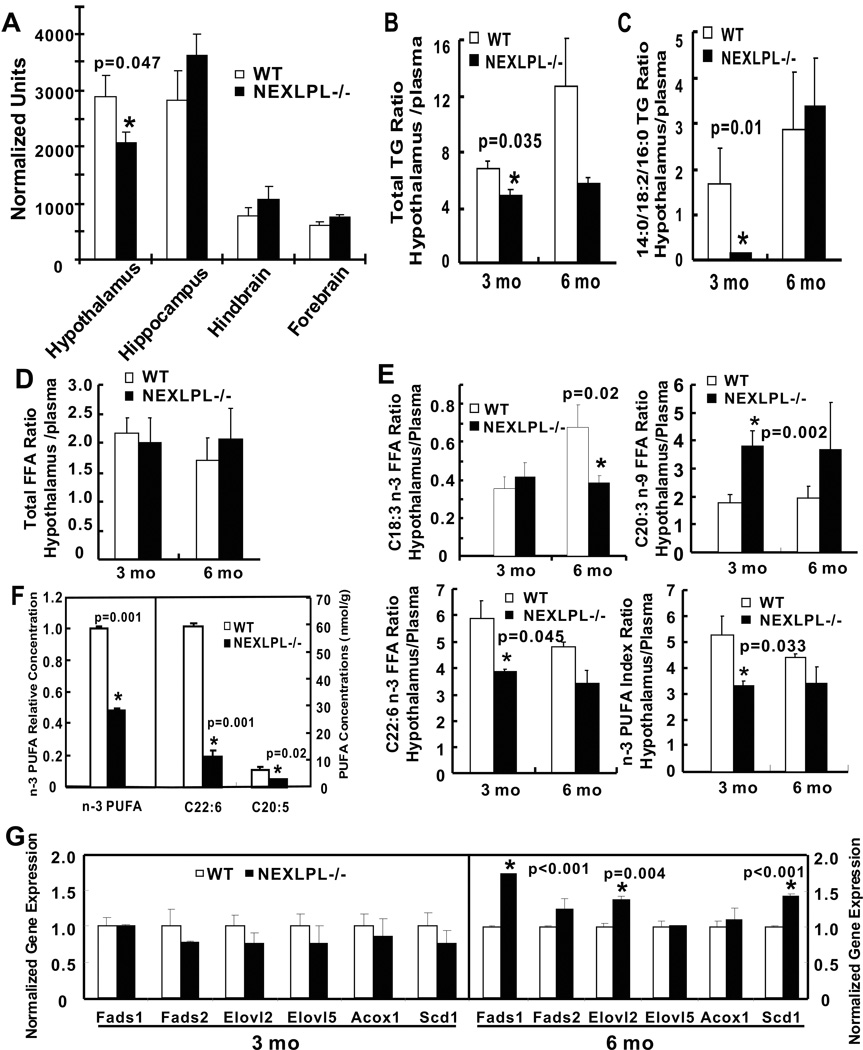
Fig. 3. Brain lipid metabolism in NEXLPL−/− mice at 3, 6 mo, and 12 mo (n=6 for WT, and n=4 for NEXLPL−/− for B to E).
Lipid levels in A to E are reported with hypothalamic lipid levels normalized to plasma levels. A) Reduction of TG-rich lipoprotein derived TG/FA uptake in the hypothalamus of NEXLPL−/− mice at 3 mo (n=7 for WT, and n=6 for NEXLPL−/−). B) Total TG concentrations in the hypothalamus of 3 and 6 mo NEXLPL−/− mice. C) TG (18:2/14:0/16:0) in the hypothalamus of 3 and 6 mo NEXLPL−/− mice. D) Total FFA concentrations in the hypothalamus of 3 and 6 mo of NEXLPL−/− mice. E) Deficiency of n-3 PUFAs in 3 mo and 6 mo NEXLPL−/− mice. n-3 index is percentage of all n-3 PUFAs in total FFA. F) n-3 PUFA deficiency in the hypothalamus of 12 mo NEXLPL−/− mice (n=2 for WT, n=3 for NEXLPL−/−). G) PUFA biosynthetic enzyme pathway gene expression levels in the hypothalamus of 3 and 6 mo NEXLPL−/− mice (n=4). (See also Figure S3 & Table S2)

