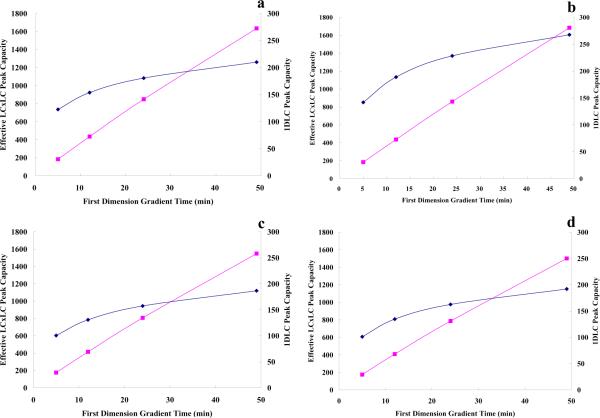
Figure 4.
Peak capacity from the optimized first dimension and the effective LC×LC peak capacity from the optimized LC×LC system (method 2 optimization) vs first dimension gradient time. a). mixture A in case 1; b). mixture B in case 1; c). mixture C in case 2; d). mixture D in case 3. Dark blue diamonds: the peak capacity from the optimized first dimension; pink squares: the effective LC×LC peak capacity from the optimized LC×LC system. See the definitions of cases and mixtures in Table 1.

