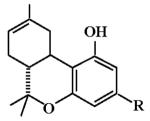
Table 1.
Cannabinoid CB1 and CB2 Receptor Binding Affinities and Pharmacological Effects of Sulfonamides with Dimethyl and Acetylene Side Chain Substitutions*
 | ||||||
|---|---|---|---|---|---|---|
| Ki (nM) | ED50 | |||||
| ID (MW) |
R | CB1 | CB2 | SA | TF | RT |
| O-2050 (418) |

|
2.5 ± 0.4 | 0.2 ± 0.1 | 69% @ 30 |
< 30 | < 30 |
| O-1991 (432) |
|
30 ± 13 | 1.4 ± 0.2 | 2 (1-3) |
0.9 (0.6-1.4) |
0.8 (0.4-1.6) |
| O-1993 (460) |
|
70 ± 10 | 86 ± 7 | 8 (3-16) |
14 (7-27) |
12 (9-15) |
| O-2113 (459) |
|
1.7 ± 0.3 | 0.08 ± 0.02 | 0.4 (0.1-1.8) |
0.3 (0.1-1) |
1.4 (0.3-4.6) |
| JWH-104** (354) |

|
909 ± 121 | 137 ± 6 | 5 (3-10) |
2 (1-3) |
1 (0.7-2) |
Kis are presented as means ± S.E.M. All ED50s are expressed as mg/kg (with 95% confidence limits in parentheses). For compounds that failed to produce either maximal or dose-related effects, the percent effect at the highest dose (mg/kg) or > highest dose tested (in cases where largest response was less than 50% of the typical maximum) is indicated. MW = molecular weight; SA = suppression of spontaneous activity; MPE = % maximum possible antinociceptive effect in tail flick assay; RT = rectal temperature.
From Wiley et al., 2002.
