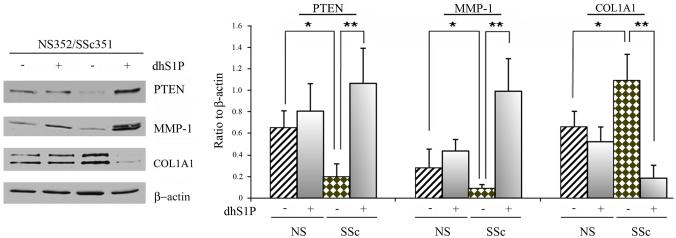
Figure 2. SSc fibroblasts show increased sensitivity to the anti-fibrotic effects of dhS1P.
Six pairs of SSc and closely matched control fibroblasts were stimulated with 0.5 μM of dhS1P for 48 hours. Left panel depicts the protein levels of PTEN, MMP-1, and collagen determined by western blotting in a representative pair. β-actin was used to normalize protein levels. Lines 1 and 2 represent NS fibroblasts, lanes 3 and 4, SSc fibroblasts. Right panel represents graphical summary of the experiment. Bar graph depicts mean±SD from all pairs tested expressed as a ratio of each protein level to β-actin level. *p<0.05, **p<0.01, ***p<0.001

