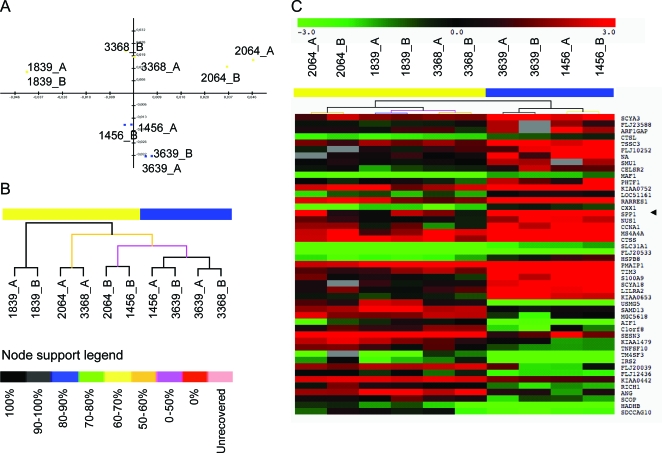
Figure 1. Retrospective mRNA profiling of muscle biopsies from patients with Duchenne muscular dystrophy (DMD) showing mild vs severe clinical course.
(A) Component 1 (X-axis) and component 3 (Y-axis) plot of the correspondence analysis. Component 3 is seen to separate patients with DMD into 2 groups (yellow: 1,839, 3,368, 2,064; blue: 1,456, 3,639) corresponding to mild (yellow) vs severe (blue) clinical progression. (B) Bootstrap Pearson clustering analysis of the patients. Clustering of 1,456 and 3,639 patients is 100% bootstrap supported and is separated by the second cluster (3,668, 2,064, 1,839) linked to the first by a node presenting 0%–50% bootstrap supporting score. (C) Patients' bootstrap clusterization considering differentially expressed genes between the 2 patient groups. Gene expression values are expressed in log scale ratio relating to a common RNA control pool (log2 DMD patient/control pool). Right arrows highlight SSP1. All cluster tree presents the yellow/blue upper bar representing the subdivision of the patients with DMD in late loss of ambulation (yellow) and early loss of ambulation (red).

