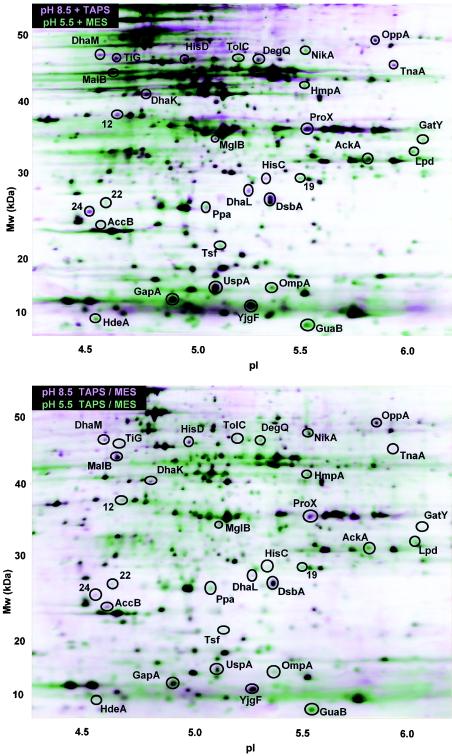
FIG. 1.
pH-dependent protein profiles after anaerobic growth. The horizontal axis represents the approximate pH range of the isoelectric focusing first dimension, and the vertical axis represents the molecular weight (Mw). In the layered view shown two composite images, one representing growth at pH 8.5 (pink) and one representing growth at pH 5.5 (green), are superimposed. Each composite image is based on three 2-D gels from independent replicate cultures. All cultures of E. coli W3110 were grown at 37°C to an OD600 of 0.15 in LBK with buffer of the appropriate pH at a concentration of 100 mM as described in Materials and Methods. (A) Cultures grown in LBK buffered with 100 mM MES (pH 5.5) or 100 mM TAPS (pH 8.5). (B) Cultures grown in LBK buffered with a mixture of 50 mM MES and 50 mM TAPS for both pH 5.5 and pH 8.5.

