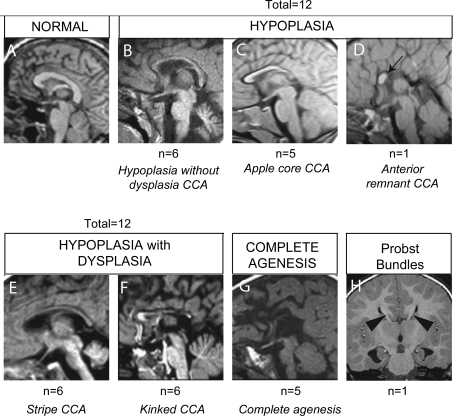
Figure 2. Midline sagittal MRI representing the spectrum of corpus callosum (CC) abnormalities in 30 patients with corpus callosal abnormalities (CCA).
(A) Normal CC. (B–D) HYPOPLASIA class of CCA. (B) Hypoplasia without dysplasia CCA, (C) apple core CCA, (D) Anterior remnant CCA (black arrow). (E, F) HYPOPLASIA WITH DYSPLASIA class of CCA. (E) Stripe CCA, (F) kinked CCA. (G) COMPLETE AGENESIS. (H) Example of Probst bundles. Number of patients with each class of CCA, and each subtype of CCA, from a cohort of 29 patients.

