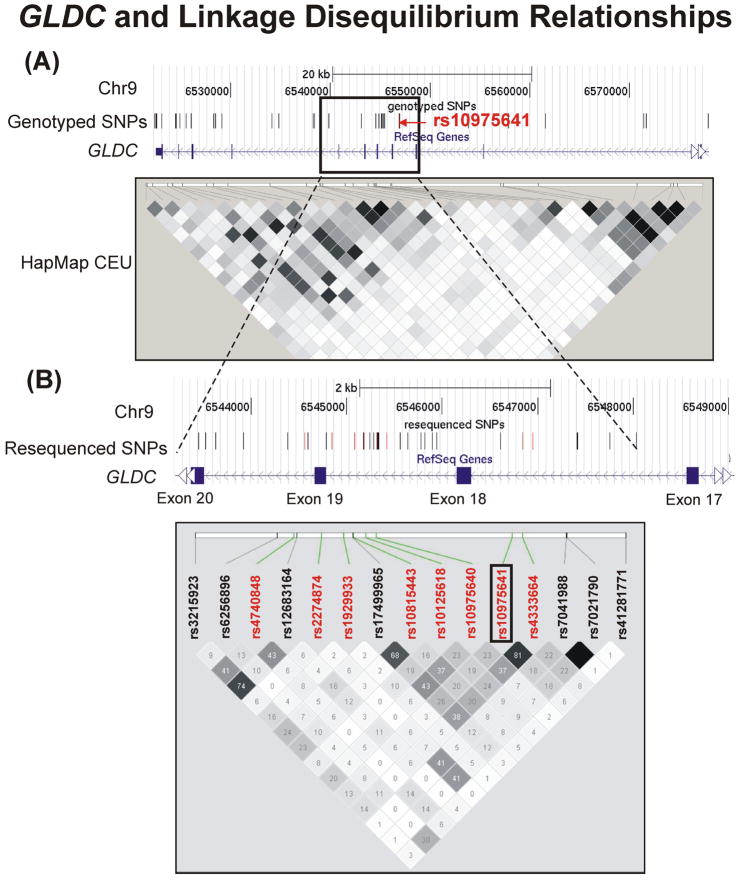
Figure 4.
The GLDC gene and its linkage disequilibrium relationships. (A) A region of chromosome 9 spanning the portion of the GLDC gene from which tag SNPs were selected for genotyping is shown. The box indicates a region around rs10975641 that was resequenced for purpose of fine-mapping. A Haploview (39) plot was generated using data from CEPH HapMap samples (CEU). (B) A “closer” view of the LD structure in the region of interest. Both genotyped (red) tag SNPs and SNPs identified during the resequencing effort (9) are plotted.

