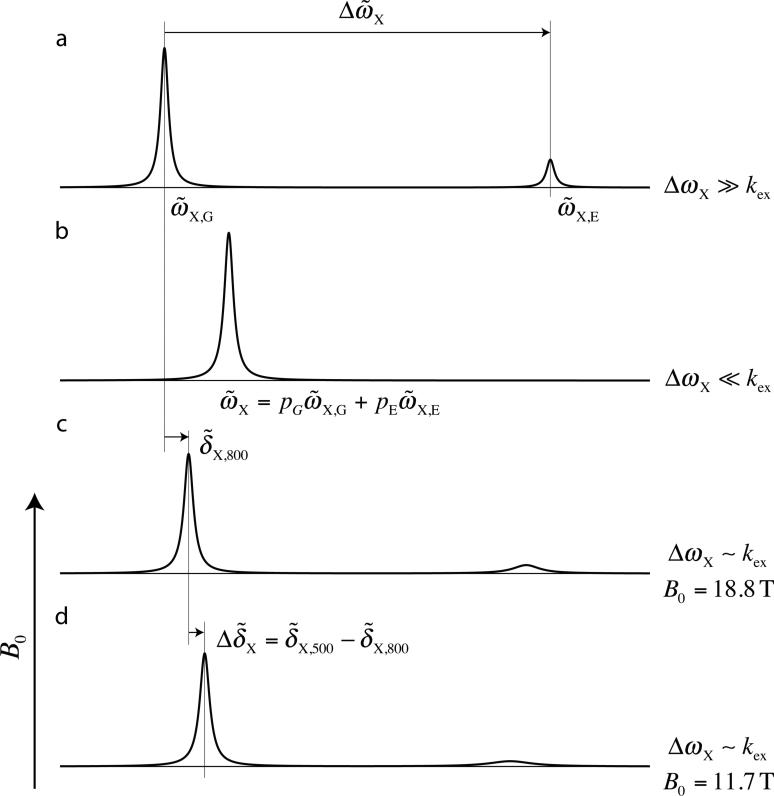
Figure 1.
Schematic illustrating the relation between and B0 for a single spin exchanging between two sites with distinct chemical shifts. (a) In the limit the system is in slow exchange and separate peaks are observed at positions that are essentially independent of exchange ( and ). (b) In the limit where , a single peak is observed at the population weighted average of and . (c,d) As B0 increases decreases so that the exchanging system moves towards the slow exchange regime and hence decreases.

