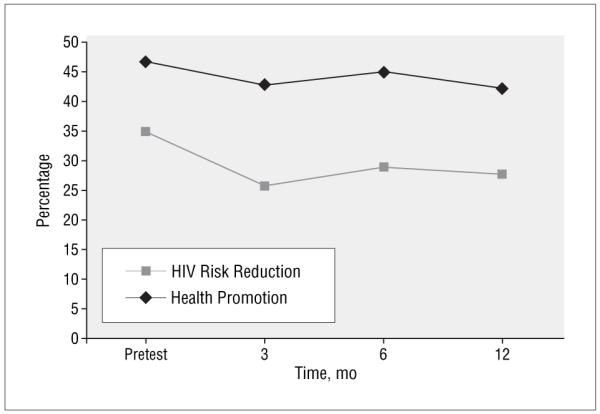
Figure 4.

Consistent condom use in the past 3 months. This graph does not represent results of generalized estimation equation analyses. The percentage (SE) was calculated for the outcome variable; unadjusted scores are presented for each time period. Scores were calculated only for participants who were sexually active at baseline (human immunodeficiency virus [HIV] risk-reduction group [n = 106], health-promotion group [n = 127]). Values for the HIV risk-reduction group are as follows: pretest, 46.8% (0.50%); 3 mo, 42.6% (0.50%); 6 mo, 44.8% (0.50%); and 12 mo, 42.2% (0.50%). Values for the health-promotion group are as follows: pretest, 34.8% (0.48%); 3 mo, 25.7% (0.44%); 6 mo, 28.8% (0.46%); and 12 mo, 27.6% (0.45%).
