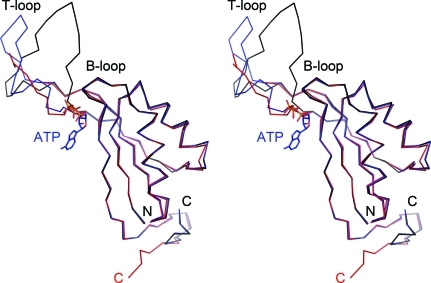
Figure 3.
Structural comparison of Af-GlnK1 and Af-GlnK2. Stereo image of the ligand-free GlnK1 monomer (red) and GlnK2 (ligand-free in black, ATP-bound in blue). The overall very high similarity of the core structures is only disrupted at the T-loop region. Here, although nine residues could not be modelled in GlnK1, a more compact fold for this loop is obviously observed in GlnK1.

