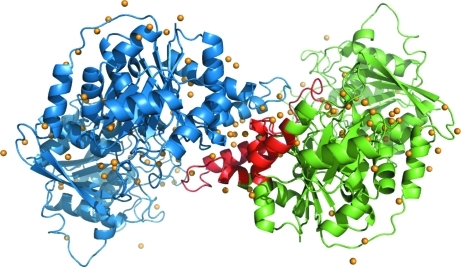
Figure 2.
Dimeric structure of S. solfataricus CTP synthase. Molecule A is diplayed in green and molecule B is displayed in blue. The dimeric contact area of the A molecule is shown in red. Water molecules are shown in orange. This figure was prepared in PyMOL (DeLano, 2002 ▶).

